What is Impact Analysis?
Suppose there was an event. The event could be something you did (e.g., an ad-campaign), something that happened outside your control (e.g., Covid), or for that matter just something you can define from your data (e.g., an experiment with treatment and control groups). Impact analysis helps you analyse the impact of the event on outcomes you can define. For example:
- What was the impact of my marketing campaign (event) on customer conversion (outcome)?
- For what kind of orders does late delivery (event) cause a higher rate of churn (outcome)?
- How did the profile (outcome) of patients coming into the healthcare system change due to Covid (event)?
Where impact analysis differs from (and builds upon) A/B analysis or classical experiments analysis is that the model not only gives you the impact, but also the conditions driving the impact. So, in the marketing campaign example above, you get overall change in conversion, and you also get drivers for the delta, i.e., customer profiles where the campaign is being highly effective, and profiles where it isn't or maybe even counter-productive.
What Exactly Does Impact Analysis Generate?
Daisho automatically gives you a bunch of insights:
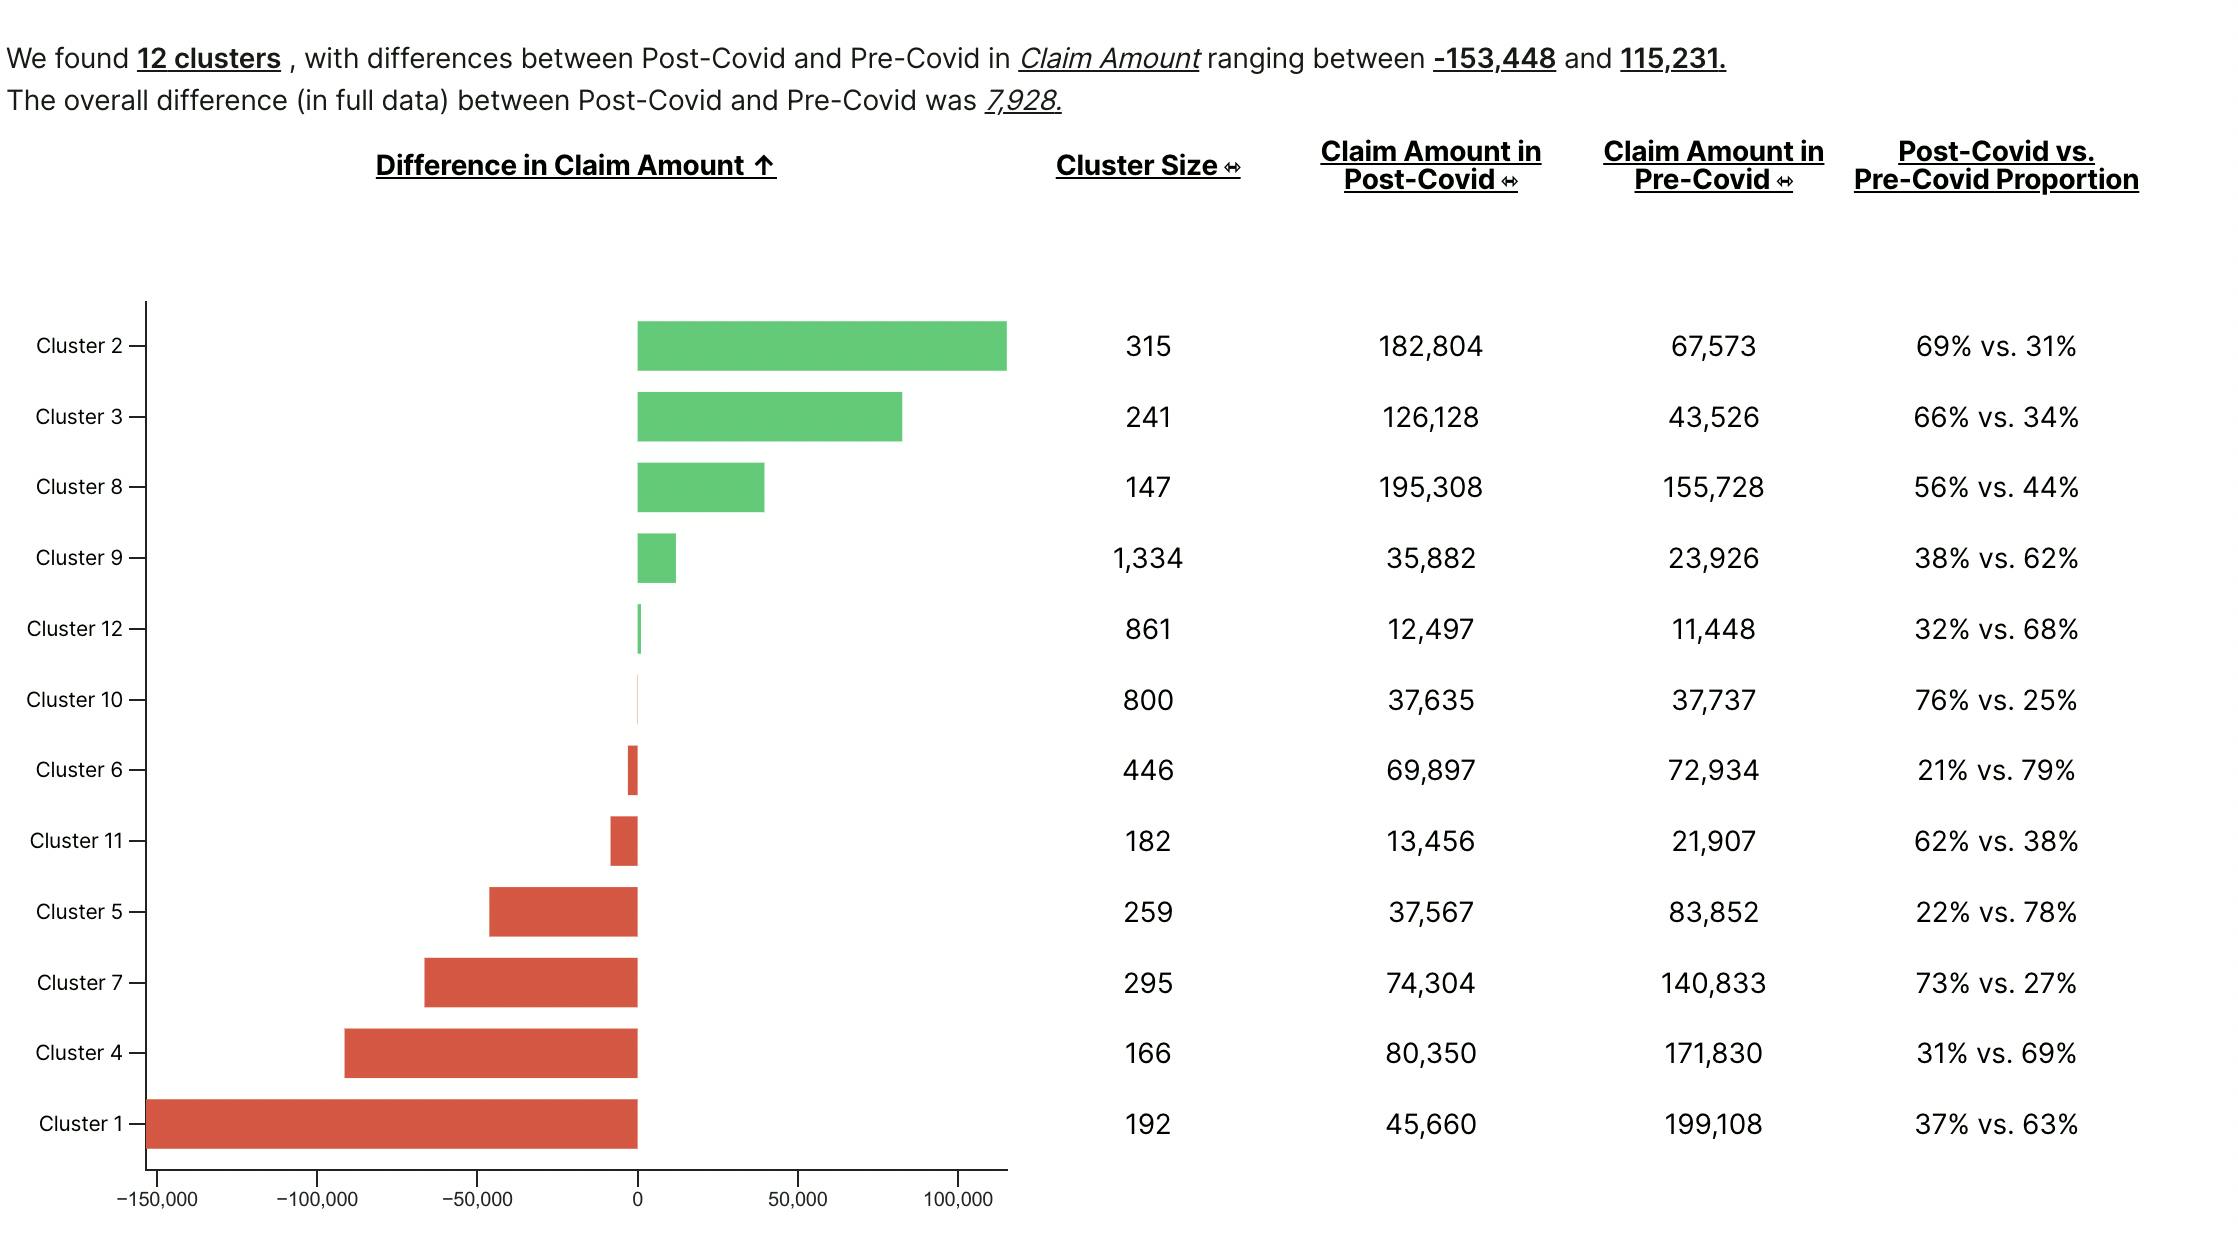
Clusters where impact is most different from the rest of the data - based on raw variables as well as Signal Factory.

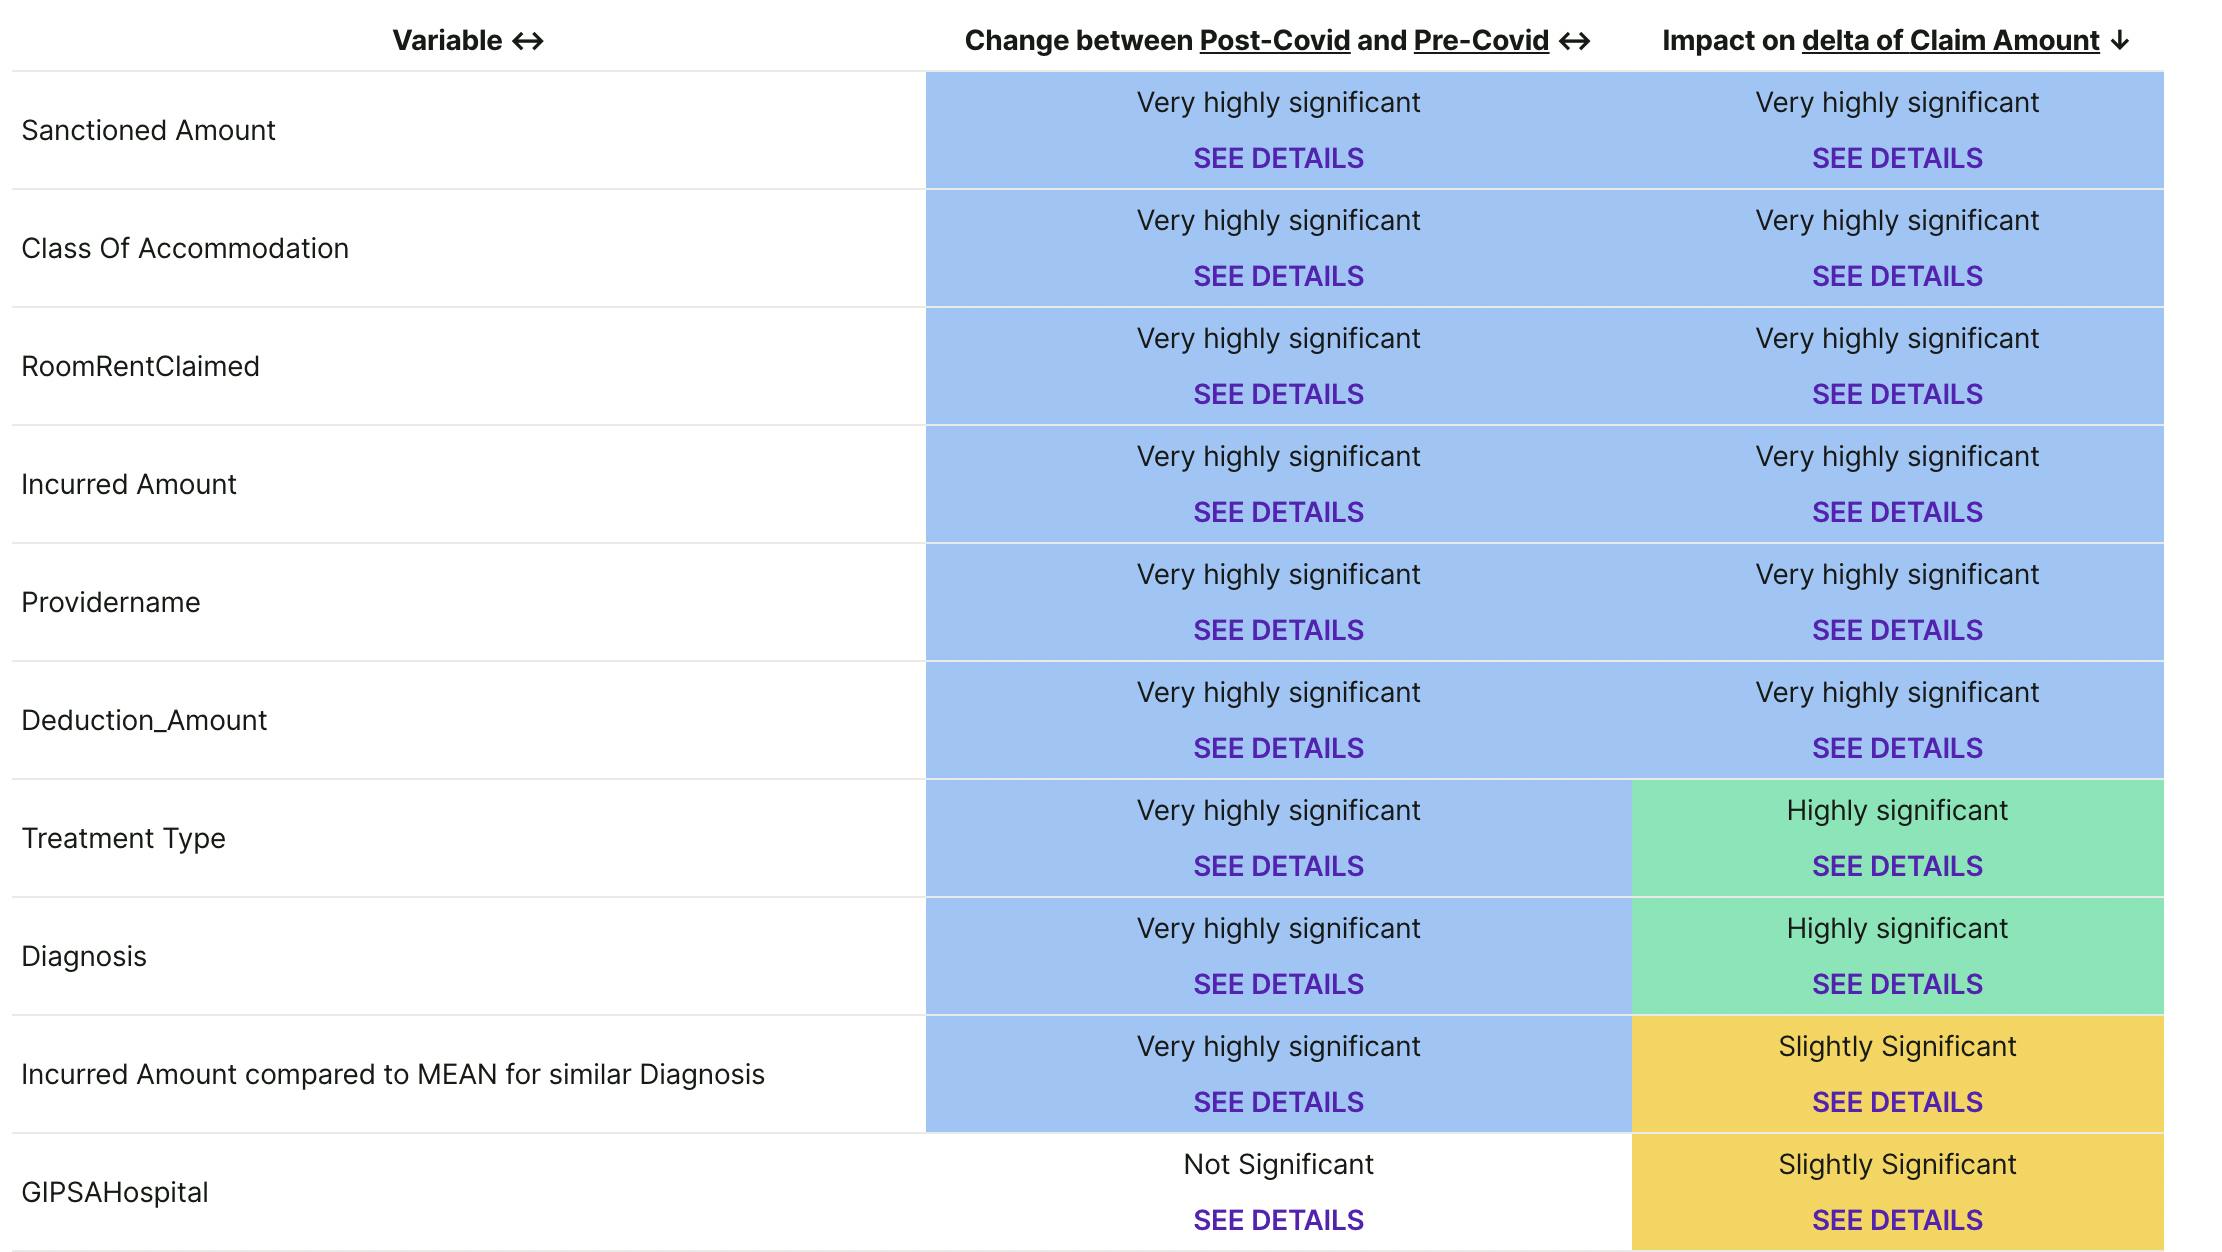
Univariate Analysis - for each column, tests if the column is different when the event occurred vs not-occurred, and if the relationship of the column with outcome has changed based on event.

In addition to these insights, you also have the ability to export predictions from this data, as well as to generate predictions on new data.
What is the data and information required?
The first question is related to the nature of outcome - this decides the recipe you choose on Daisho. The outcome can be of two types:
- A continuous variable, i.e. a number you want to predict. For example: weekly sales, production yield, etc. In Daisho, you would be using the Impact Analysis (Continuous Outcome) recipe. All you need to do is first choose the data, and then point at the correct outcome variable in your data.
- A binary outcome, i.e., a YES/NO (or True/False). For example: customer conversion, loan default, machine failure etc. In Daisho, you would be using the Impact Analysis (Binary Outcome) recipe. Once you choose the data, you then define conditions for YES/True/Success in your outcome. For example, you might define machine failure (outcome) as temperature (a column) crossing 60 degrees, AND pressure (another column) below 20 psi. You set these conditions in the recipe.
The next question is event definition. Your data MUST contain information related to the event. Once you choose the data, you then define conditions for the machine to identify rows where the event has happened. For example, you might define the event as time-stamp (a column) after March 1st, 2020, AND channel (another column) as XYZ. Both recipes above allow you to define conditions for the event.
Daisho can build impact analysis on any data where you can define an event, and an outcome variable. Daisho assumes ALL columns in the data are potential drivers, and automatically flags the most impactful/powerful ones.
However, do note that Daisho's Impact Analysis analyses the data at a row-by-row level. So for example, if you want to find impact on weekly sales, and the data you have is transaction data, you first need to aggregate into your data into weekly format (Convert to Time Series Box) before using this recipe.
What's Available Now?
We got a bunch of insights already here. Predictive models, clusters, univariate analysis, etc. Once you build models, you can also set them up for Predictions. You can then use these models in your regular workflow!
You can even export all the data - including signals from SignalFactory if you wish!
